See what big investors are really buying
Market Essence is a free financial-market insights app that turns raw institutional filings into clear, interactive visuals — so you can see what the biggest investors own, what they are buying and selling, and how money is moving. No spreadsheets. No jargon.
Clear, visual insights
Complex filings rendered as charts you can read in seconds.
Built on official data
Sourced from SEC EDGAR 13F filings and Alpha Vantage.
Free to explore
Start investigating any stock or institution right away.
Understand any institution's portfolio
Pick an institution — like Vanguard or BlackRock — and see exactly what it owns, how that has changed, and where it is placing its bets.
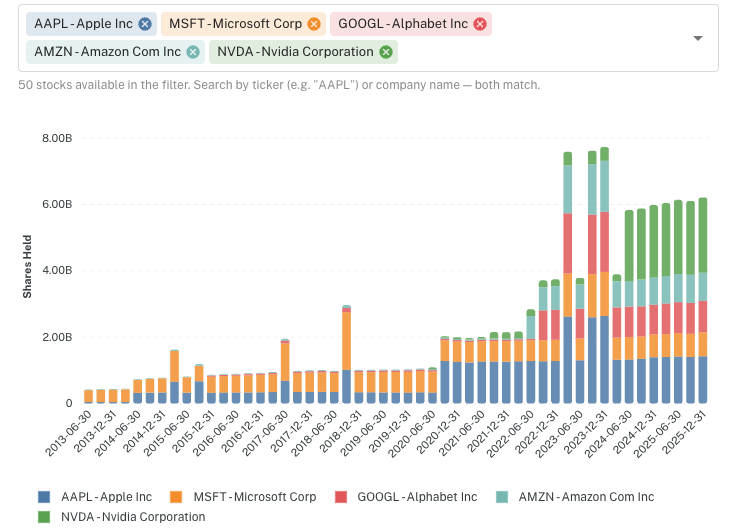
See how a portfolio is built — and how it shifts
Watch an institution's holdings mix evolve across years. Spot the positions it has grown, trimmed, or exited, and read how its view of the market and individual stocks is changing — all in one stacked timeline.
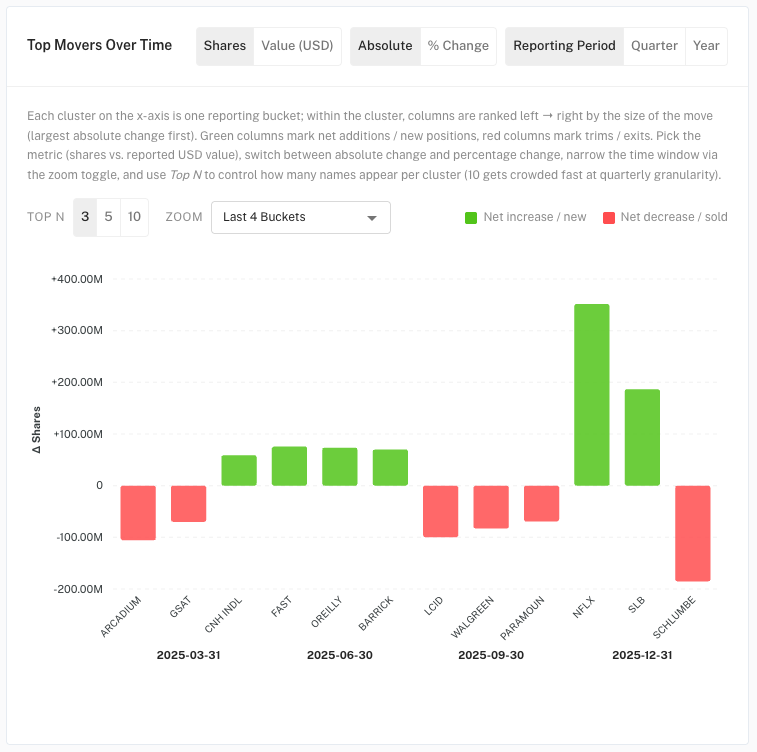
Know exactly what they bought and sold
Each quarter, see the biggest changes at a glance. Green columns are buys and new positions, red are trims and exits — ranked by the size of the move, so the conviction trades stand out.
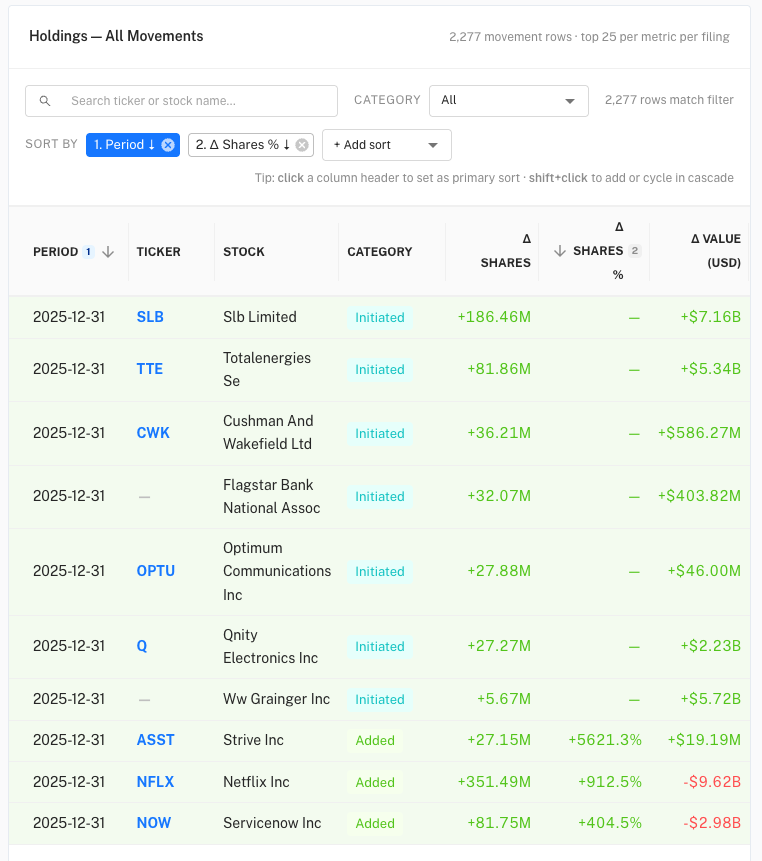
Drill into every position change
A searchable, sortable record of every move across an institution's full filing history. Filter by stock, size, or change type to follow a single name or scan the whole book.
See who owns a stock — and how money flows
Search any ticker and uncover the institutions behind it: who is holding, who is buying, who is heading for the exit.
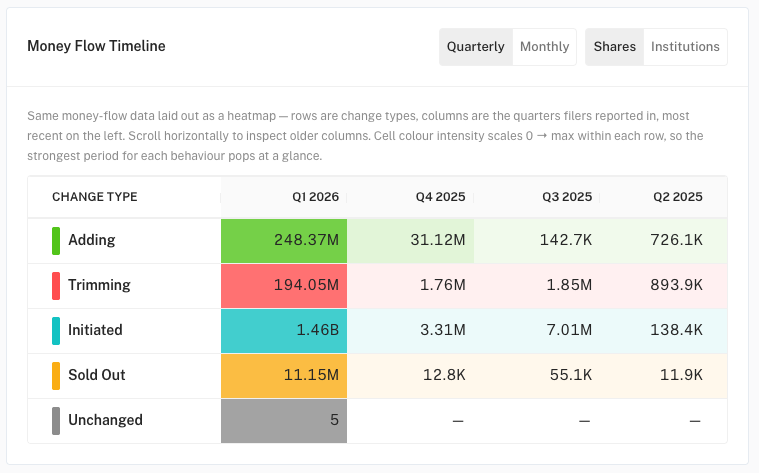
Track the money quarter by quarter
Follow how institutions added, trimmed, initiated, or exited a stock over time. The view highlights the busiest periods so you can instantly see when sentiment shifted.
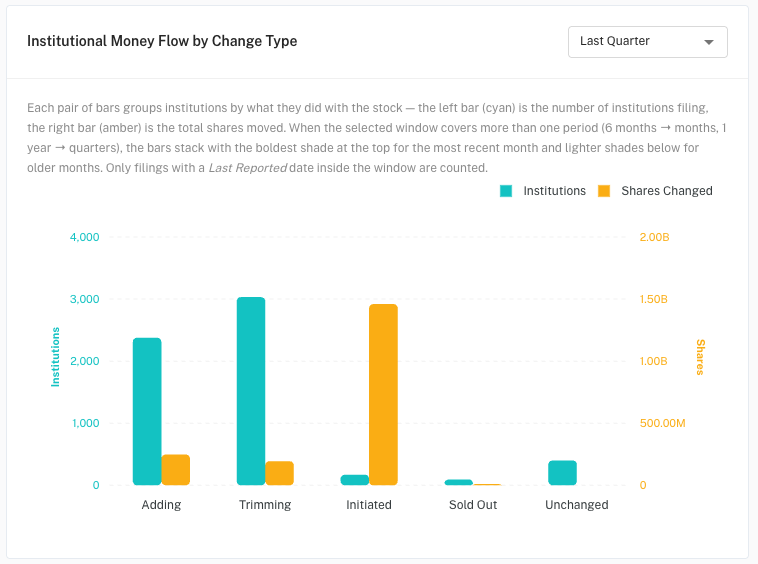
Weigh buying against selling at a glance
A side-by-side breakdown of how many institutions moved and how many shares changed hands — split by buying, selling, opening, and closing positions — so the balance of pressure is obvious.
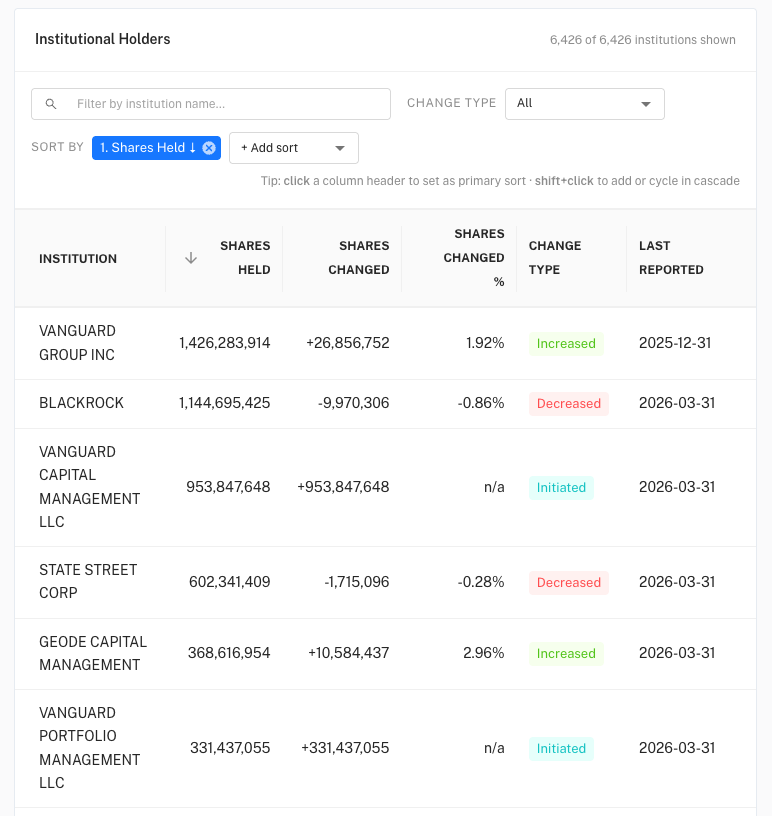
Every institutional holder in one place
A full, sortable list of the institutions holding the stock — how much each owns, how their stake changed, and when they last reported. Sort and filter to find the movers that matter.
Ready to follow the smart money?
Start exploring institutional holdings and stock holders today — it is free to get started.
Or create a free account to save your searches.
Clear, visual financial-markets insights for investors, traders, and anyone who follows the markets.
Company
© 2026 Market Essence. Data sourced from SEC EDGAR and Alpha Vantage. For informational purposes only — not investment advice.